

How to Measure AI Visibility: Citation Rate, SOV & Prominence
AI search visibility should be measured using a fixed and repeatable protocol rather than a single dashboard score.
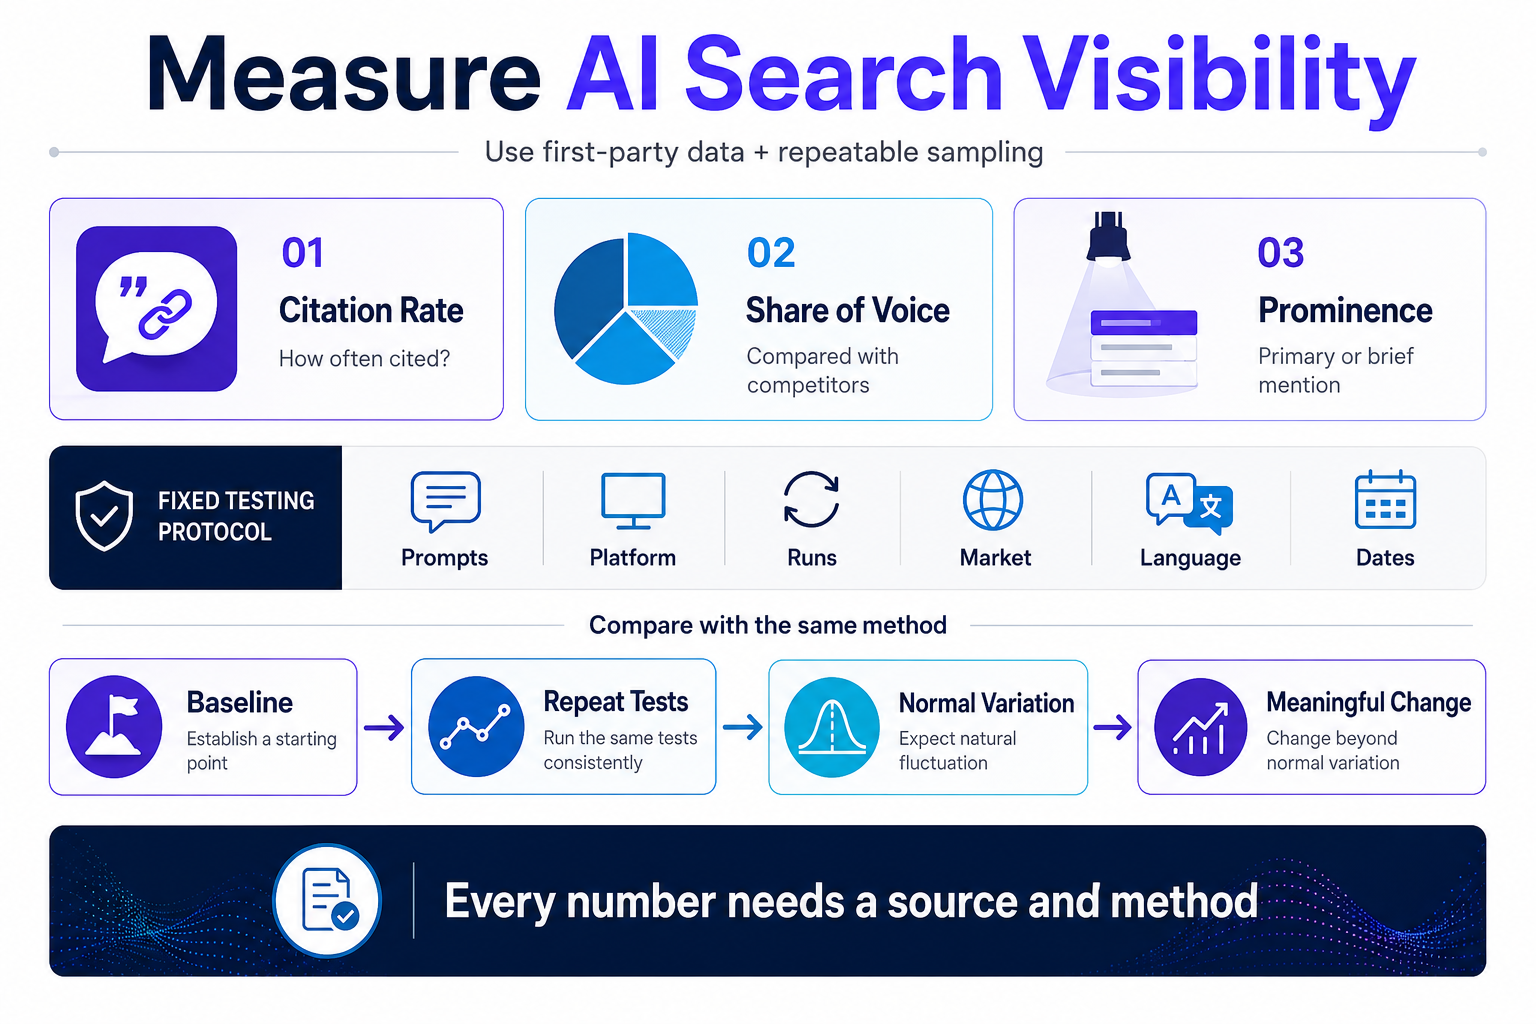
A practical measurement framework should track three core metrics: Citation Rate, Competitive Share of Voice and Prominence. It should also define the prompt set, platforms, markets, languages, valid runs, exclusion rules and counting rules before testing begins.
For a small to medium-sized measurement programme, a fixed set of around 30–60 prompts with repeated runs can provide a practical starting point. Establish a baseline first, observe normal variation, and only then decide whether later changes are meaningful.
First-party data such as Google Search Console can provide useful platform-specific evidence, while cross-platform prompt sampling is still needed for comparisons across ChatGPT, Perplexity and other AI platforms.
Three Core Metrics for Measuring AI Visibility
There is no single cross-platform AI visibility score published by the major AI platforms. A score such as “AI visibility: 70” therefore means little unless the report also explains what was measured and how the number was calculated.
Within our measurement framework, we track AI visibility from three angles:
- Citation Rate: How often does an AI answer cite your domain?
- Competitive Share of Voice (SOV): How often does your brand appear compared with a named competitor set?
- Prominence: How prominently does your brand appear when it is included in an answer?
What's Ours and What Isn't
Citation Rate, competitive SOV and Prominence are our working definitions for comparing AI visibility consistently across measurement periods. The noise floor and The Citation Loop are also working terms used within our measurement process.
The important point is not whether a dashboard uses the same labels. It is whether the methodology behind each number is stated clearly enough to repeat the measurement under the same conditions.
1. Citation Rate: How Often Do AI Answers Cite Your Website?
Citation Rate is the share of valid prompt runs in which an AI answer cites your domain.
Citation Rate = Valid runs citing your domain ÷ Total valid runs
For example:
18 cited runs ÷ 60 valid runs = 30% Citation Rate
The percentage only becomes meaningful when the denominator is clear.
Sixty different prompts tested once each and 30 prompts tested twice each both produce 60 runs, but they are not the same measurement design. Platform, market, language and run count also affect how directly one result can be compared with another.
For that reason, Citation Rate should always be reported together with the testing protocol used to produce it.
The measurement rules below define valid runs, exclusions, citations, brand mentions and repeated appearances.
2. Competitive Share of Voice: How Often Do You Appear Compared With Competitors?
Competitive share of voice is your brand's share of all recorded appearances by a fixed, named competitor set across the same prompt runs.
Competitive SOV = Your brand appearances ÷ Total appearances by your brand and the named competitors
For example, if your brand appears 35 times and the named competitors appear a combined 65 times:
35 ÷ (35 + 65) = 35% Competitive SOV
But a statement such as “We have 35% AI Share of Voice” is not enough on its own.
The report should also identify the competitor set, prompt set, AI platforms, markets, languages and counting method used.
The competitor set should remain fixed between measurement periods. If one round compares your brand with three competitors and the next compares it with ten, the two SOV figures are not directly comparable even if the formula itself has not changed.
For SOV, a brand appearance is counted once per run when the brand is named in the answer or its official domain is cited. If both occur in the same run, the brand still contributes only one appearance to the SOV calculation.
3. Prominence: How Prominently Does the Brand Appear?
Citation Rate shows how often your domain is cited, while SOV shows how often your brand appears relative to competitors.
Prominence records how the brand is presented within each AI-generated answer.
Our framework uses four levels:
Primary recommendation → Named alternative → Cited source → Passing mention
For example:
“Brand A is our top recommendation. Brand B and Brand C are also worth considering.”
would normally be classified as:
- Brand A → P1 Primary recommendation
- Brand B → P2 Named alternative
- Brand C → P2 Named alternative
If a brand's official domain is cited only to support a factual statement, that appearance would normally be classified as:
- Brand domain → P3 Cited source
If a brand is named without being recommended and without its official domain being cited, that appearance would normally be classified as:
- Brand → P4 Passing mention
This makes Prominence more repeatable than relying on a general impression of whether a brand “looked important” in the answer.
The Measurement Rules We Apply
For AI visibility metrics to be comparable, the counting and classification rules need to be defined before testing begins.
The same rules should then be applied across analysts, platforms and measurement periods.
What Counts as a Valid Run?
A valid run is a completed AI response generated under the intended testing conditions.
A run is counted as valid when:
- the full prompt was submitted successfully
- the intended AI platform or surface was tested
- the response was complete enough to evaluate
- the intended market and language were used
- no technical error or abnormal interruption prevented the result from being assessed
A run should be excluded when:
- the platform returns an error instead of a usable answer
- the response is incomplete or materially truncated
- the wrong market or language was tested
- the run does not follow the defined testing protocol
- another technical issue makes the result unreliable for comparison
Every excluded run should be logged together with the reason for exclusion.
Do not selectively repeat unsuccessful runs until a more favourable answer appears.
The denominator used for Citation Rate should include only the valid runs defined under the same exclusion rules.
What Counts as a Citation or Brand Mention?
A citation and a brand mention are not the same thing and should be recorded separately.
A citation is recorded when the AI answer explicitly attributes information to your domain or includes your domain as a linked source.
A brand mention is recorded when the brand is named in the answer without being used as an attributed or linked source.
For example:
“According to example.com…”
or a linked reference to example.com would count as a citation.
By contrast:
“Brand A is one provider worth considering.”
would count as a brand mention if no source attribution or link to the brand’s domain is included.
A single answer can contain both a citation and a brand mention. These should remain separate fields in the measurement dataset rather than being combined into one appearance metric.
This distinction matters because:
Not cited ≠ not mentioned.
A brand may still appear in an AI answer even when its website is not cited as the supporting source.
AI systems can mention a brand without linking to its website because brand mentions and source citations are different parts of the answer. A brand may be named from information already available to the model or from the context used to generate the response, while a citation requires the answer to explicitly attribute or link to a source.
For that reason, the absence of a citation should not automatically be interpreted as the absence of brand visibility.
How Should Repeated Appearances Be Counted?
Repeated appearances within the same AI answer should not automatically create multiple counts.
For this measurement framework:
- a domain receives a maximum of one citation count per run
- a brand receives a maximum of one brand mention count per run
- repeated links to the same domain within one answer do not create additional citation counts
- repeated mentions of the same brand within one answer do not create additional mention counts
For example, if an AI answer links to the same domain three times, that run still records:
1 cited run
rather than:
3 citations
Likewise, if the same brand is mentioned several times in one response, it still records:
1 brand appearance for that run
The importance of repeated or more prominent appearances is captured separately through Prominence, rather than by inflating the appearance count.
How Should Prominence Be Classified?
Prominence records the role a brand plays within an AI-generated answer.
Each brand appearance should be classified using the same P1–P4 criteria.
| Level | Classification | Rule |
| P1 | Primary recommendation | The brand is presented as the main recommendation or appears first in a clearly ordered recommendation where no other option is ranked above it. |
| P2 | Named alternative | The brand is presented as one of several options or alternatives but is not clearly the primary recommendation. |
| P3 | Cited source | The brand's official domain is used as a source supporting information in the answer, but the brand is not presented as a recommended option. |
| P4 | Passing mention | The brand is named without clear source attribution and without being presented as a recommendation. |
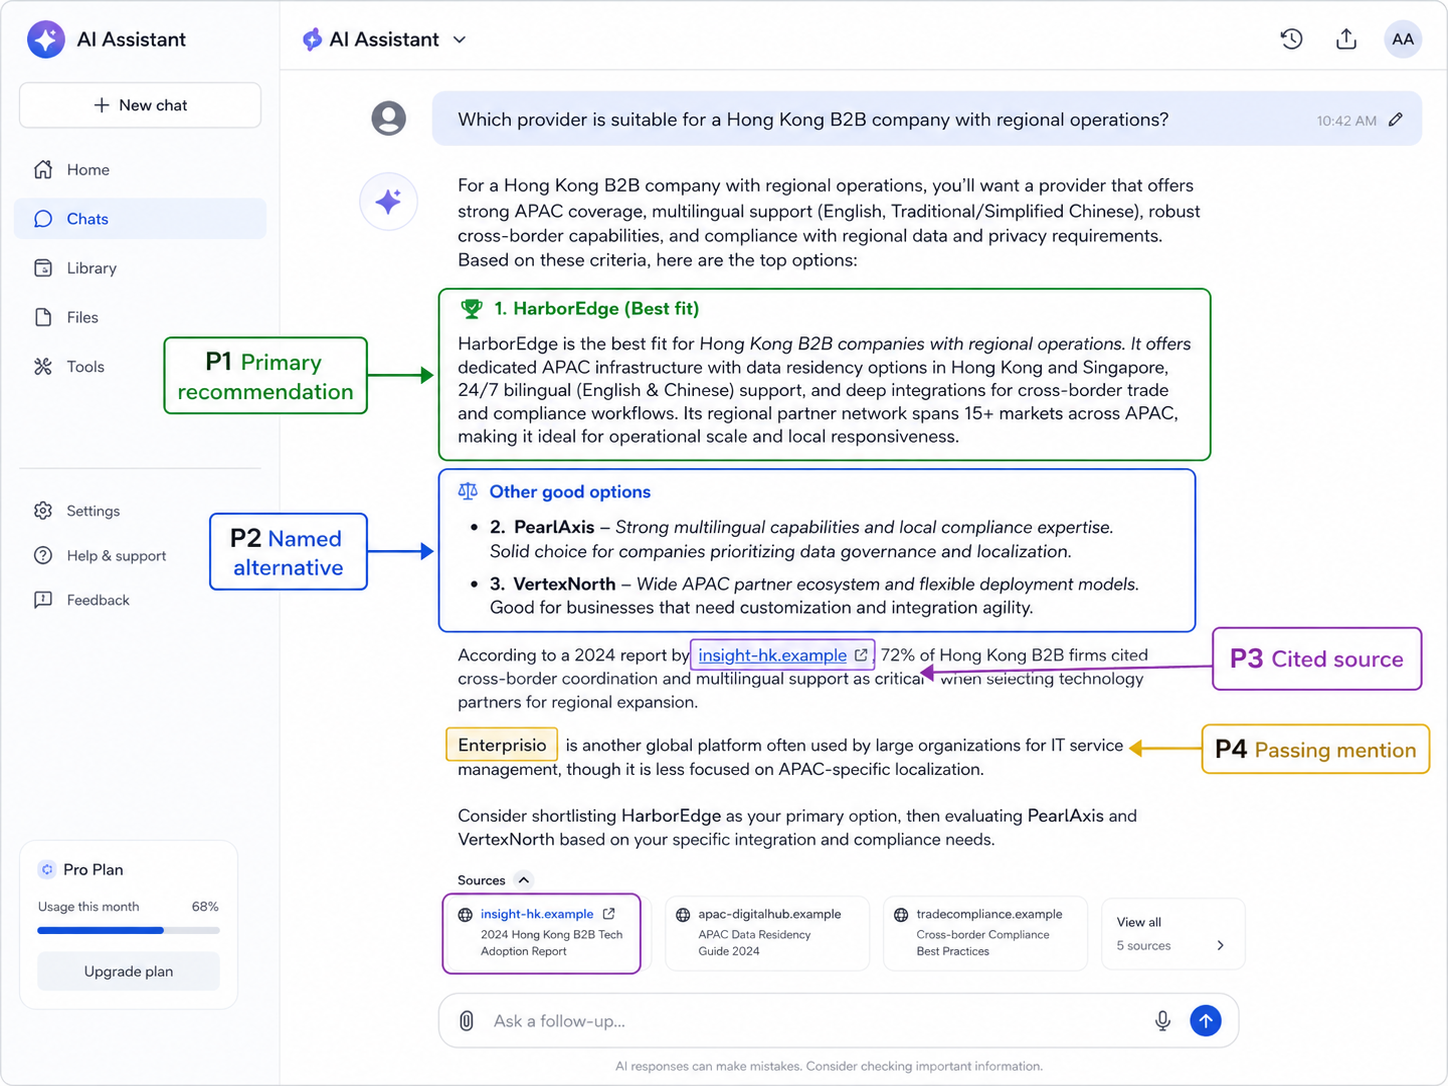
Classification should be based on the wording and structure of the answer itself.
If the role is genuinely ambiguous, use the less prominent classification rather than assigning a stronger position without clear evidence.
How Is the Noise Floor Estimated?
The noise floor is used to estimate how much AI visibility can vary even when the measurement setup has not intentionally changed.
Start by running the same frozen prompt set under the same measurement protocol across repeated baseline measurements.
Keep the following conditions as consistent as possible:
- prompt wording
- AI platform or surface
- market
- language
- number of runs per prompt
- citation and mention definitions
- exclusion rules
- counting rules
Avoid intentionally changing the prompt set or measurement setup between the baseline measurements.
For example:
Baseline measurement 1: 30% Citation Rate
Baseline measurement 2: 27% Citation Rate
The absolute difference is:
3 percentage points
Within this framework, that difference provides an initial estimate of the observed noise floor.
If a later Citation Rate moves from 30% to 32%, that change would still fall within the amount of variation already observed and should not automatically be treated as meaningful improvement.
Keep the individual baseline measurements in the report rather than showing only their average. Repeat the comparison over time because the amount of observed variation may itself change.
The noise floor is not a formal statistical confidence interval. It is an observed measure of variation used to help distinguish normal movement from a change that may warrant further investigation.
Sampling Protocol Is Part of the Measurement
An AI visibility report is only comparable when its testing protocol is clear.
How were these numbers actually measured?
If the testing conditions change between measurement rounds, two Citation Rates or Share of Voice figures may not be directly comparable even when they use the same metric.
Before relying on an AI visibility tool or dashboard, it is also worth understanding what a visibility tracker is actually sampling.
When establishing an AI visibility baseline, define and record the following conditions:
- Prompt set: Which questions are being tested, and what exact wording is used?
- AI platform / surface: Which AI platform or feature is being tested?
- Market / location: Which market or location is the measurement intended to represent?
- Language: Which language is being used?
- Run count: How many times is each prompt tested?
- Competitor set: Which named competitors are included when SOV is being measured?
- Testing window / cadence: When is each measurement round conducted, and how consistently are the intervals maintained?
- Account / personalisation settings: Where relevant, could login status, account history or personalisation affect the result?
- Citation and mention definitions: What counts as a citation, and what counts only as a brand mention?
- Counting rules: How are repeated appearances of the same brand or domain within a single answer counted?
- Exclusion rules: Which failed, incomplete or abnormal runs should be excluded?
Keep these conditions with the measurement record and apply the same definitions in later rounds.
The key point is:
When the sampling protocol changes, the results may no longer be directly comparable.
Prompts Should Reflect Real Buyer Journey Questions
Do not simply turn an SEO keyword mechanically into:
keyword + best
Keyword research can still help identify topics worth testing. AI visibility testing should include questions that target customers may realistically ask.
For example:
Which provider is suitable for a Hong Kong B2B company with regional operations?
This is closer to how a user might actually use AI search to research information, compare options and choose a supplier.
If results need to be analysed by search intent, prompts can be grouped into consistent categories such as informational research, comparison, commercial consideration or supplier selection.
The category names themselves are less important than this principle:
Use the same classification method before and after optimisation.
Use 30–60 Fixed Prompts as a Starting Point
A set of 30–60 fixed prompts can be a practical starting point for a small to medium-sized measurement programme. The more important requirement is to keep the prompt set stable enough for meaningful comparison over time.
Do not keep changing the prompt set simply because the first round of results does not look good.
If the test questions change substantially halfway through, the before-and-after results become difficult to compare.
Repeat Each Prompt 3–5 Times to Observe Variation
Similarly, repeating each prompt three to five times can be a practical starting point for observing variation across repeated runs.
The main purpose of repeated testing is to observe whether the same question produces noticeably different results under the same conditions.
Generative AI responses can vary depending on testing time, platform updates and other conditions.
Therefore:
A single run should not be treated as a stable measure of AI visibility.
Run Your First AI Visibility Measurement
Once the measurement rules and sampling protocol are defined, the first measurement can be run as a structured baseline exercise.
A practical sequence is:
1. Freeze the prompt set
Use the same 30–60 fixed prompts selected for the measurement programme. Record the exact wording and keep a versioned copy so later rounds can be compared against the same set.
2. Record the sampling protocol
Before running the prompts, record every condition defined in the sampling protocol above, including the platform, market, language, run count, competitor set, testing window, account and personalisation settings, citation and mention definitions, counting rules and exclusion rules.
Keep this record with the measurement results so the same setup can be reproduced in later rounds.
3. Run each prompt the same number of times
Repeat each prompt using the same run count across the selected platforms. For example, if the protocol uses three runs per prompt, apply three runs consistently rather than changing the number depending on the result.
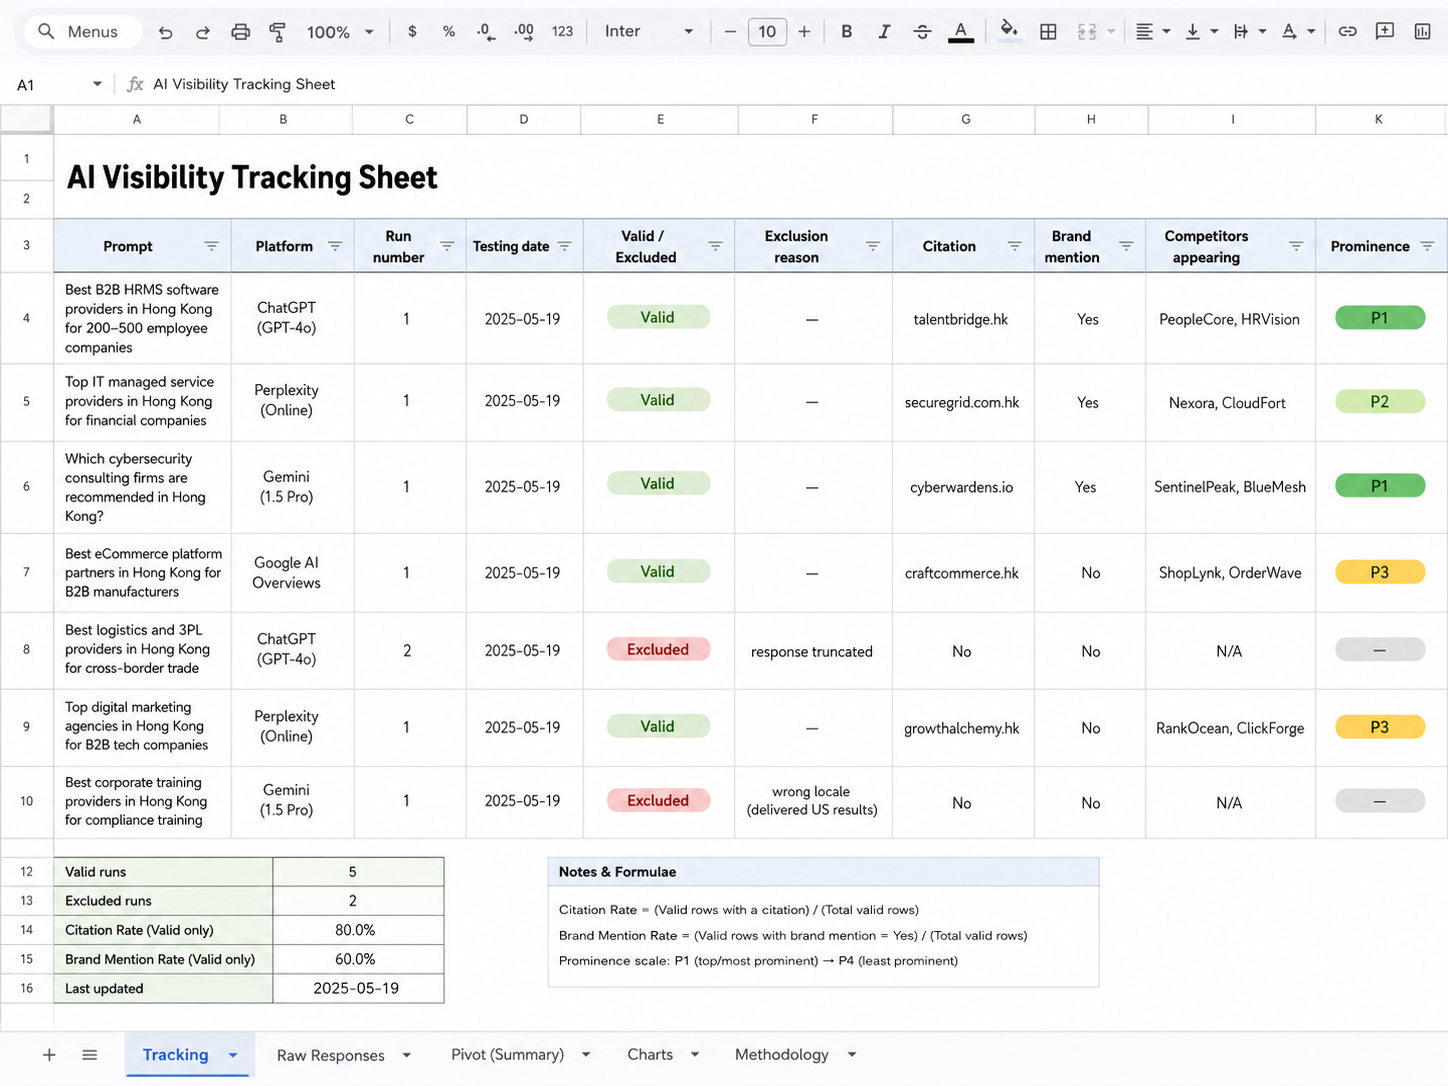
4. Log one row for every run
At minimum, record:
- prompt
- platform
- run number
- testing date
- valid or excluded status
- exclusion reason, if applicable
- citation
- brand mention
- competitors appearing
- Prominence level
5. Calculate the first baseline
Once the valid runs are complete, calculate Citation Rate, Competitive SOV and Prominence using the fixed definitions established earlier in the article.
Keep the raw run-level results as well as the summary metrics. This makes it possible to audit how the final numbers were produced.
6. Save the baseline before making major changes
The first completed measurement becomes the reference point for later comparison.
Do not change the prompt set, competitor set or counting rules simply because the first baseline is lower than expected.
The purpose of the first measurement is not to produce an attractive score. It is to create a repeatable starting point that can be measured again under the same, or a reasonably comparable, conditions.
Two Metrics That Cannot Represent AI Visibility on Their Own
Some metrics are related to AI search but cannot represent AI visibility on their own.
Two common examples are traditional SEO rankings and AI referral traffic.
1. Traditional SEO Rankings
It would be inaccurate to simply say:
“Rankings no longer matter.”
For Google, that is not correct.
Google states that its generative AI features in Search, including AI Overviews and AI Mode, are rooted in its core Search ranking and quality systems. To be eligible to appear as a supporting link, a page must be indexed and eligible to appear in Google Search with a snippet, while meeting Google Search’s existing technical requirements.
So:
Traditional search visibility still matters.
But the two should not be treated as the same metric:
Traditional ranking position ≠ AI Citation Rate
A page that performs well in organic search will not necessarily be cited in every AI answer. Likewise, an increase in AI citations does not automatically mean that the page’s traditional ranking is improving.
Therefore:
As explained in our GEO vs SEO comparison, traditional SEO rankings and AI citations should be measured separately, then analysed together.
2. AI Referral Traffic
AI referral traffic shows website visits attributed to links from AI platforms, but it only captures users who actually click through.
A user may see your brand or citation in an AI-generated answer without visiting your website, so referral traffic should not be treated as a complete measure of AI visibility.
According to OpenAI's publisher documentation, ChatGPT automatically includes the UTM parameter utm_source=chatgpt.com in referral URLs, allowing inbound traffic from ChatGPT search results to be tracked in analytics platforms.
When setting up the segment, build it yourself and confirm it against one known click before you report from it. Attribution and tracking behaviour can change as platforms evolve, and the analytics setup should be verified rather than assumed.
Consider a user who:
Sees your brand in ChatGPT
→ Does not click
→ Searches your brand name on Google one week later
→ Eventually converts directly
In this situation, standard web analytics may not be able to fully reconstruct how much the original AI exposure contributed to the final conversion.
So:
AI referral traffic is useful for measuring attributed click-through traffic, but it is not a complete measure of AI visibility.
What Google's Own Reporting Does and Doesn't Give You
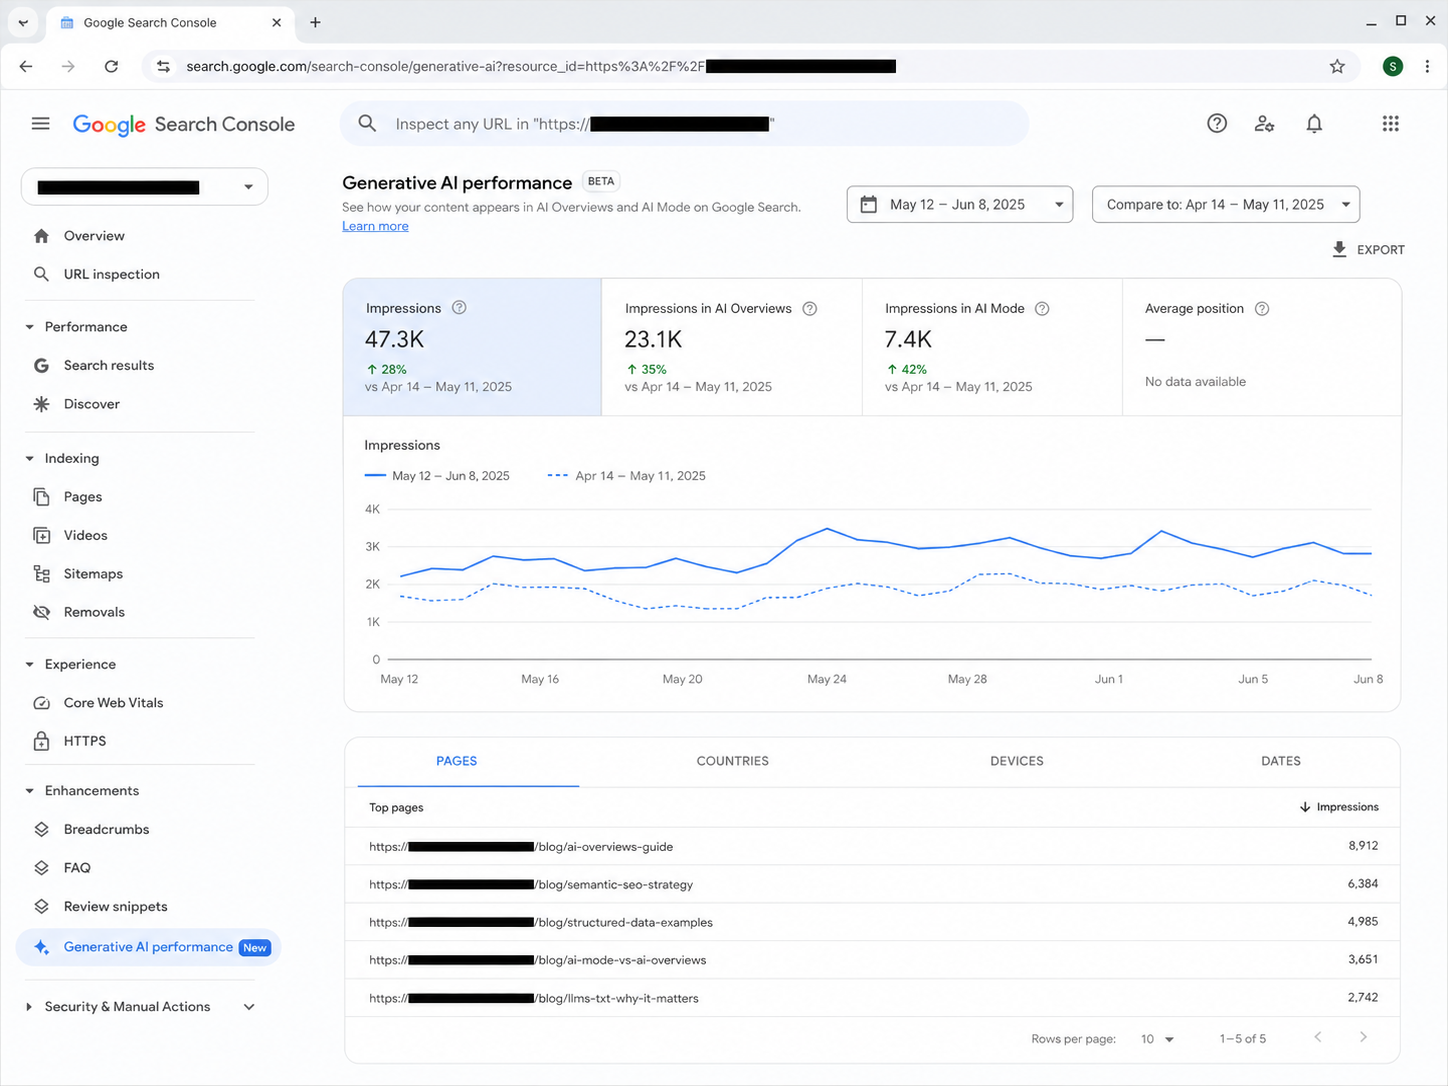
On 3 June 2026, Google began rolling out a Generative AI performance report in Search Console to a subset of website owners. The report provides first-party data for AI Overviews and AI Mode, with impressions available by page, country, device and date.
The dedicated report currently provides impressions rather than separate clicks, CTR or average position metrics for generative AI features. This makes it useful for measuring AI-specific exposure, but it does not show the full path from visibility to traffic or conversion.
Google also states that pages appearing in AI features are already included in overall Search Console traffic under the Web search type. The dedicated Generative AI performance report therefore provides a more specific view of AI-related impressions rather than creating an entirely separate source of Search data.
However, this reporting only covers generative AI features on Google Search. It cannot replace cross-platform AI visibility measurement for platforms such as ChatGPT or Perplexity.
Search Console first-party data and cross-platform sampling should complement each other rather than replace each other.
Establish a Baseline, Estimate Normal Variation, Then Set a Target
An AI visibility programme should not begin by promising:
“We will increase citations by 20% in three months.”
A more reasonable sequence is:
Baseline → Retest with the same protocol → Estimate normal variation → Set a target
Step 1: Establish a Baseline
Before major optimisation work begins, run the first measurement under the full sampling protocol defined above, and keep every one of those conditions fixed in later rounds.
A baseline is only a baseline for the conditions under which it was measured.
This first round becomes the reference point for future comparison.
For example:
Citation Rate baseline = 30%
If a later measurement rises to 35% or 40%, that increase should be compared against the same prompt set, platforms, market, language, run count and other protocol conditions.
Without a consistent baseline, it becomes difficult to tell whether the change reflects genuine improvement, normal variation or simply a change in how the measurement was conducted.
Step 2: Estimate Normal Variation
After establishing the baseline, repeat the same measurement under the same protocol to observe how much Citation Rate moves without a deliberate change to the measurement setup.
This observed variation provides a reference point for interpreting later results. The measurement rules above explain how we estimate the noise floor from repeated baseline measurements.
Keep the original measurements rather than reporting only an average, so later changes can be compared with the variation already observed.
Step 3: Set a Target Only After Estimating Normal Variation
Suppose a 30% baseline is followed by repeated measurements that show several percentage points of normal variation.
If Citation Rate later increases from 30% to 32%, that change may still fall within the variation already observed and should not automatically be treated as meaningful improvement.
It is more useful to look at whether the change:
- clearly moves beyond the usual variation
- continues across multiple testing waves
- appears in important commercial prompts
- is accompanied by improvements in other AI visibility or business indicators
Estimate normal variation first, then decide whether the uplift is meaningful.
This is more reliable than setting an attractive growth target first and then looking for data that supports it.
A Fall in SOV Does Not Necessarily Mean Competitors Are Getting Stronger
A fall in Share of Voice does not automatically mean a competitor has become stronger. One possibility to rule out first is citation contraction: the AI platform may simply be showing fewer cited sources across its answers.
Consider a simplified example. If an answer previously surfaced ten sources but later surfaces only three, brands that appeared lower in that source set may disappear completely, while the remaining top sources account for a larger share of all appearances. In that situation, citation contraction can polarise Share of Voice rather than reduce every brand proportionally.
This gives you a more useful way to diagnose an SOV decline.
First check three things:
- Has the measurement protocol changed?
- Has the total number of counted brand appearances across the prompt set also fallen?
- Are specific named competitors actually increasing consistently?
If Citation Rate, your SOV and total counted appearances all fall, the change may reflect broader citation contraction rather than a competitor-specific gain.
If your SOV falls while total counted appearances remain broadly stable, and a specific competitor continues to gain appearances across repeated measurements, the competitive change is more likely to be worth investigating.
The distinction matters because the responses are different. Citation contraction means fewer positions may be available, so the priority is to improve your chances of appearing among the sources that remain visible. A genuine competitor gain means you should investigate where that competitor is gaining visibility, which prompts are driving the change and what content or source signals may be contributing to it.
A decline in SOV is therefore a diagnostic signal, not direct proof that competitors have become stronger.
What Should a Defensible AI Visibility Report Include?
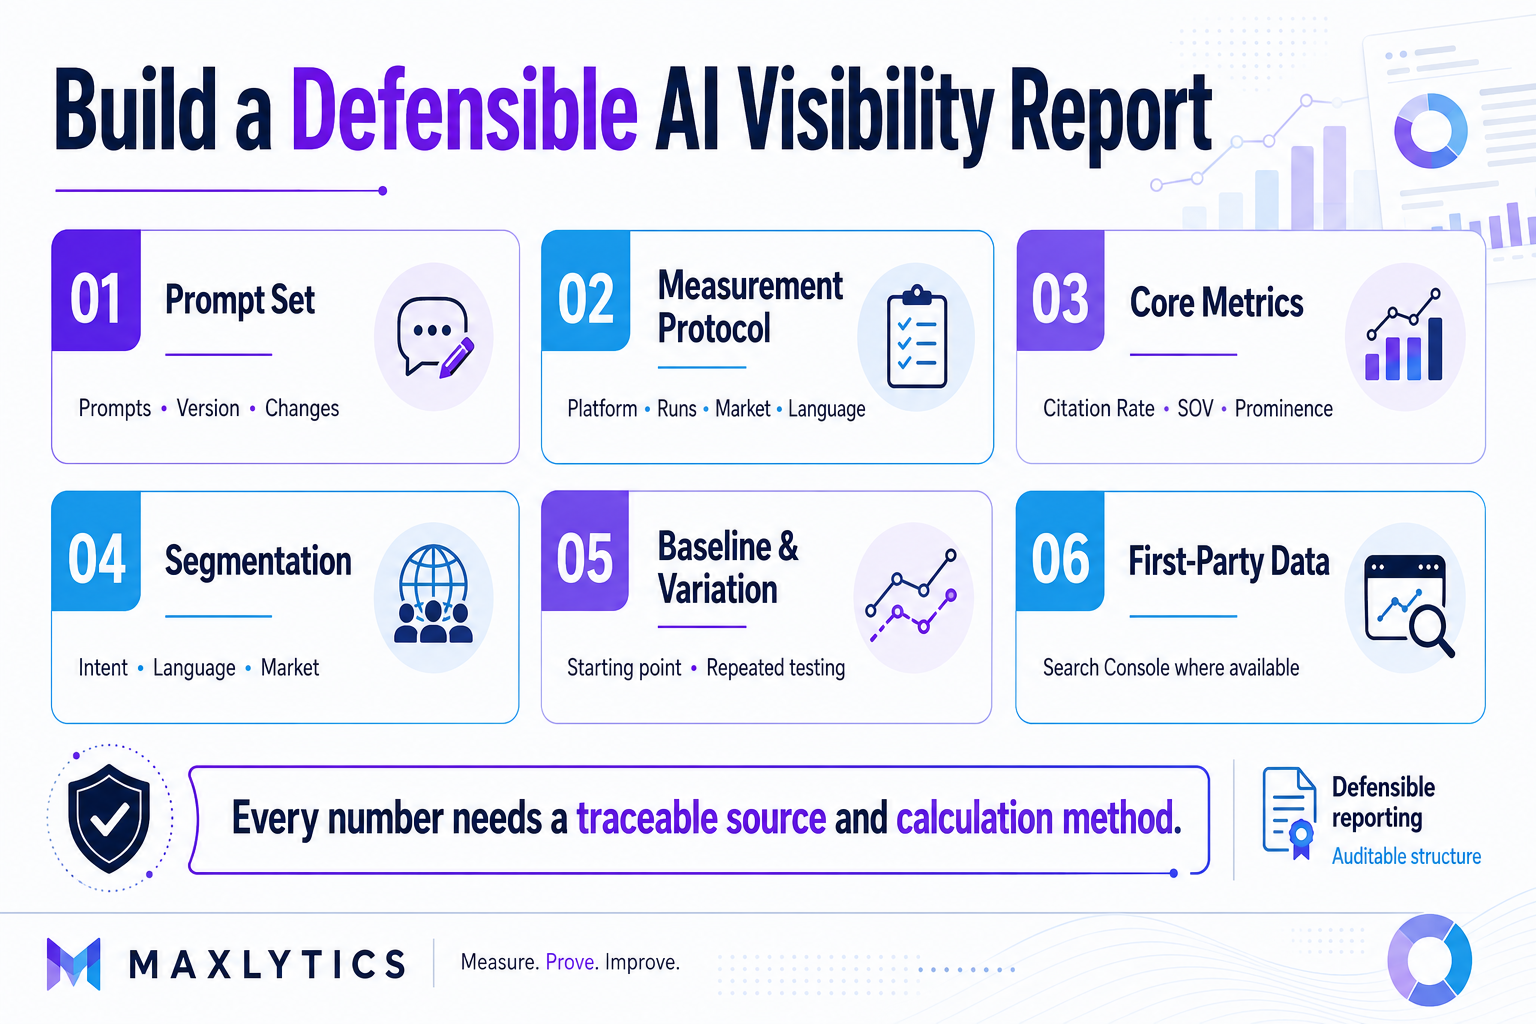
A defensible AI visibility report should do more than display a few attractive percentages. It should show enough of the methodology for another person to understand how each number was produced, what it covers and what it does not cover.
| Report component | At minimum, include |
| Prompt set | The prompts tested, the version used and whether anything changed between measurement periods |
| Measurement protocol | AI platform, number of runs, market, language, testing window, exclusion rules and counting rules |
| Valid runs | Total scheduled runs, valid runs, excluded runs and the reason for each exclusion |
| Segmented results | Results broken down by platform or surface, intent, language and market where relevant |
| Citation Rate | The denominator, the citation definition and the number of valid runs citing your domain |
| Brand mentions | Mention counts reported separately from citations using the fixed mention definition |
| Competitive SOV | The named competitor set, the appearance counting rule and how the figure was calculated |
| Prominence | The fixed P1–P4 classification criteria: Primary recommendation, Named alternative, Cited source and Passing mention |
| Baseline / noise floor | Baseline performance and the observed variation from repeated baseline measurements |
| First-party data | Search Console generative AI performance data, where available, clearly labelled as Google-only first-party data |
The core principle is simple:
Every number should have a traceable source, denominator and calculation method.
For example, if a report only says:
Citation Rate: 35%
without showing the prompt set, valid runs, platforms or counting rules, the number is difficult to audit and difficult to compare with a later measurement.
Google Search Console data should be labelled separately from fixed-prompt cross-platform sampling. Competitive SOV, Prominence and the noise floor are calculated or classified from sampling data using the rules defined earlier in the article.
These data sources can appear in the same report, but they should not be blended into a single AI visibility score without explaining how each metric was produced.
Which Variables Should Be Separated in a Hong Kong Measurement Design?
In Hong Kong, AI visibility measurement often needs to account for different languages, search intents and markets. Results should therefore not automatically be combined into a single overall score.
Depending on the measurement scope, it may be useful to separate:
- English vs Traditional Chinese
- Hong Kong vs other markets
- Local intent vs non-local intent
- B2B vs consumer
What Does Our Hong Kong Sample Show?
Our Hong Kong sample shows why category and search intent should be measured separately rather than blended into one visibility score.
Among keywords with usable data, Google AI Overviews appeared for 10 of 16 marketing and AI-search keywords (62.5%), compared with 31 of 39 cross-industry Hong Kong commercial and consumer-oriented keywords (79.5%).
This does not establish a universal B2B-versus-consumer benchmark. It does, however, show that AI Overview visibility can vary between keyword groups. Businesses should therefore be cautious about comparing their performance with benchmarks based on substantially different categories or search sets.
Local intent also showed a pattern worth tracking separately. Of the 17 keywords that returned a local pack, 12 also returned a Google AI Overview.
The presence of local search results therefore did not prevent an AI Overview from appearing in our sample. Local-intent keywords should not be excluded simply on the assumption that AI Overviews are less relevant to them.
The missing-data cases also highlight a limitation of third-party keyword databases. Four of the five keywords with no usable SERP snapshot were emerging AI-search terms:
- generative engine optimization
- answer engine optimization
- ai seo tools
- ai overview
For emerging topics, third-party SERP databases may not always provide complete local coverage. This is one reason AI visibility measurement should not rely on a keyword database or dashboard alone. A fixed prompt set tested directly across the platforms being measured provides an additional layer of visibility tracking.
The purpose of separating these variables is not to assume that one group will perform better. It is to identify which group of tests is driving a change.
For example, if English and Chinese prompts are combined and the final result is simply:
Citation Rate: 35%
it becomes difficult to tell whether the change came from the English set, the Chinese set or both.
When Comparing English and Chinese, Test Similar Questions
If English and Traditional Chinese are being compared, both prompt sets should cover topics and search intents that are as similar as reasonably possible.
For example, if the Chinese prompts focus on product comparison while the English prompts focus on general information, a difference in results cannot automatically be attributed to language.
The difference may be driven by the questions themselves rather than the language used.
A more reliable approach is to build comparable prompt sets, track the two languages separately and interpret any difference alongside topic and search intent.
How to Read Our 60-Keyword Hong Kong Sample
In our 60-keyword Hong Kong sample, Google AI Overviews appeared for between 68% and 75% of the keywords, depending on how five keywords with no usable SERP snapshot are treated.
Both figures are based on the same 41 keywords that triggered an AI Overview:
- 41 of 55 keywords (74.5%) excludes the five keywords with no usable SERP snapshot.
- 41 of 60 keywords (68.3%) counts those five keywords as not triggered, creating a conservative lower bound under that treatment of missing data.
Reporting the range makes the denominator explicit rather than presenting either figure without explaining how missing data was handled.
The sample was based on keyword-level SERP feature data from Ahrefs Keywords Explorer, with the country set to Hong Kong and AI Overview presence identified through the serp_features field. The SERP snapshots were dated between 1 June and 10 August 2026.
The 60 keywords were selected through judgement sampling rather than random sampling. They covered eight Hong Kong industries with five keywords each, plus 20 marketing and AI-search terms. The results should therefore be treated as a third-party snapshot of Google SERPs rather than a market-wide benchmark.
It is also important to distinguish AI Overview trigger rate from Citation Rate.
AI Overview trigger rate measures whether a Google AI Overview appeared for a keyword. Citation Rate measures the share of valid prompt runs in which your domain is cited.
These are different measurements and should be tracked separately.
For the language-level comparison, language and topic are not fully separated in this sample. The Chinese-language subset skews more heavily toward consumer categories, while the English-language subset includes more B2B marketing terms.
With that limitation stated, the usable subset included 36 Chinese-language keywords and 19 English-language keywords. AI Overviews appeared for 29 of 36 Chinese-language keywords and 12 of 19 English-language keywords.
The difference should therefore be treated as an observation within this sample, not as evidence that Chinese-language keywords are inherently more likely to trigger an AI Overview.
The more useful measurement principle is:
Language should be measured separately when tracking AI search visibility in Hong Kong.
Where Does Measurement Fit into the Citation Loop?
We call this ongoing cycle The Citation Loop: measure AI visibility, make improvements, then measure again using the same methodology.
Our AI SEO process sets out four stages:
Generative Visibility Audit → Knowledge Architecture → Schema & E-E-A-T Injection → Citation Monitoring
Within this process, measurement follows a simple cycle:
Establish a baseline → Make improvements → Measure again
The first measurement establishes the starting point. Later measurements should use the same, or a reasonably comparable, protocol so that changes in AI visibility can be interpreted consistently.
For the Schema & E-E-A-T Injection stage, structured data can help make entity relationships more explicit, but it does not guarantee AI citations. Google states that structured data is not required for generative AI search and that there is no special schema.org markup that needs to be added.
How Much Revenue Does a Citation Actually Generate?
AI visibility can be measured. Citations can be measured. AI referral traffic can also be measured where referral data is available.
But the difficult question is:
How much revenue did those AI exposures actually generate?
Consider a potential customer who:
Sees your brand in an AI answer
→ Does not click
→ Searches your brand name three days later
→ Converts through another channel two weeks later
In a journey like this, it is usually difficult to determine how much the original AI exposure contributed to the final conversion.
AI search reporting can still be analysed alongside other business signals, including:
- branded search
- direct traffic
- assisted conversions
- lead source
- CRM data
- sales feedback
These should be treated as:
Supporting evidence, not proof that an AI citation directly generated revenue.
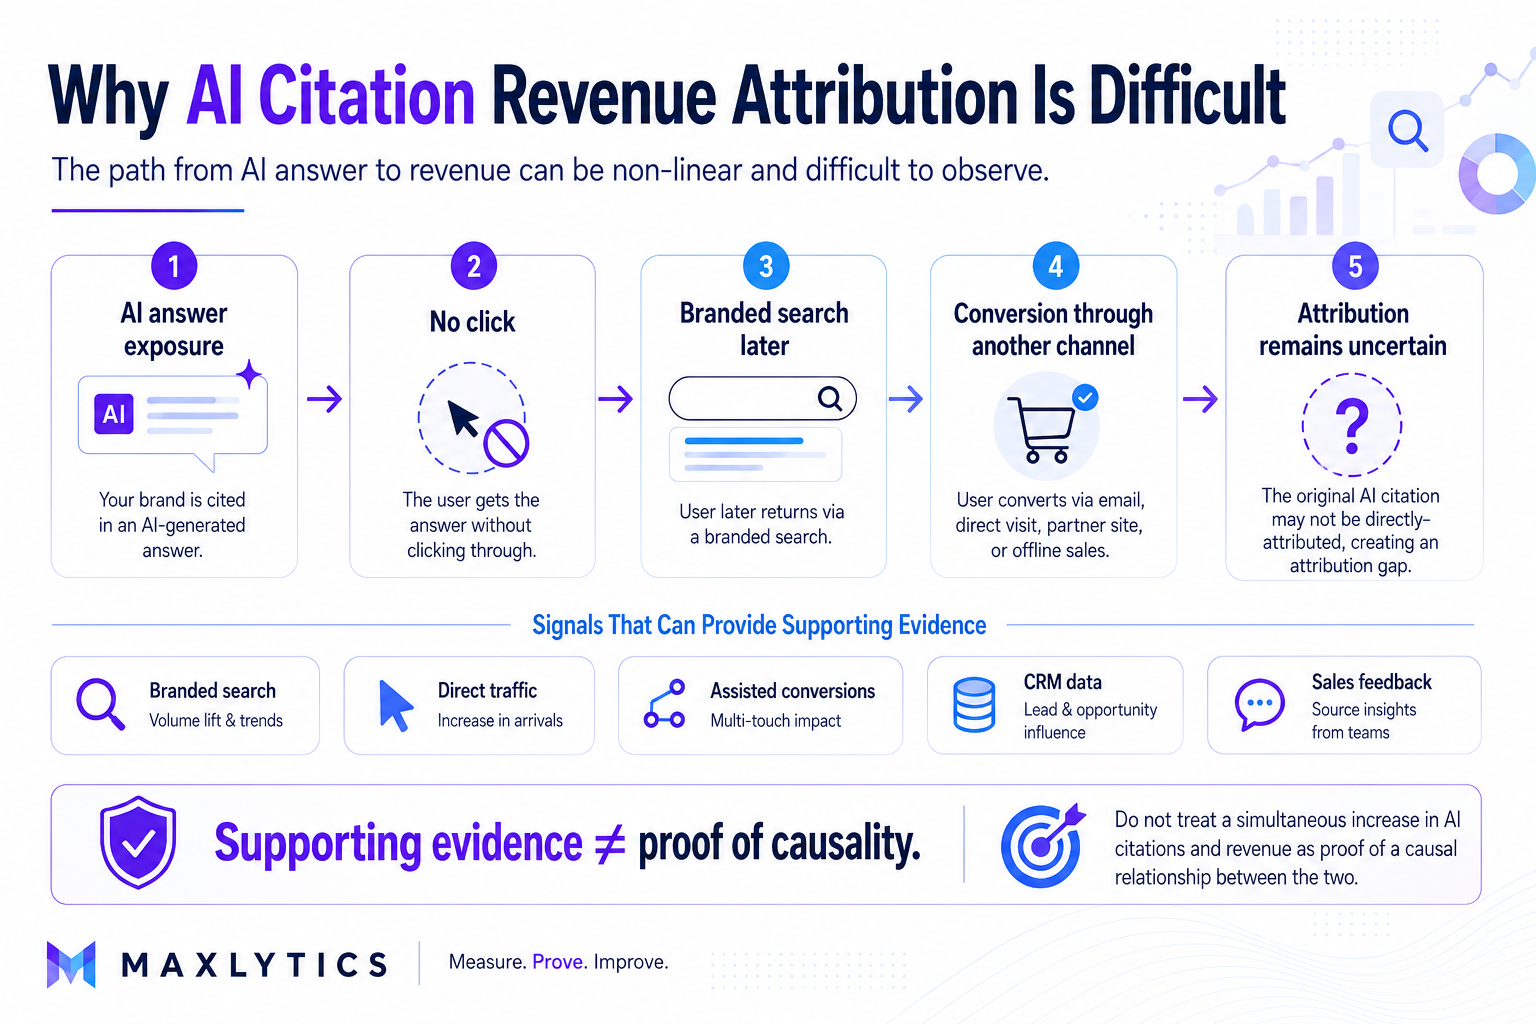
For example, an increase in branded search might also be driven by PR, paid media, offline activity, a brand campaign or other marketing channels.
Do not treat a simultaneous increase in AI citations and revenue as proof of a causal relationship between the two.
FAQ
Q1: What Is AI Visibility?
AI visibility, sometimes described as LLM visibility in the context of generative AI platforms, is how often your brand, website or content is mentioned or cited in AI-generated answers. It should be measured using a fixed prompt set across defined platforms, markets and languages rather than relying on a single dashboard score.
Q2: What Is a Good Citation Rate?
There is no universal citation rate benchmark across brands, platforms, markets and prompt sets. For example, a 20% citation rate could be relatively strong if the category leader is at 25%, while 60% could still be weak if two named competitors are both at 90%. Compare your citation rate against your own baseline and a consistent competitor set using the same fixed prompt set and measurement protocol.
Q3: Can Google Search Console Show AI Overview Performance?
Yes, if your property has access to the Generative AI performance report. It shows impressions from AI Overviews and AI Mode by page, country, device and date, but it does not replace cross-platform sampling for ChatGPT, Perplexity or other AI platforms.
Q4: Can AI Visibility Be Measured Without Buying a Tool?
Yes. Start with a fixed prompt set, choose the platforms, market and language, define the run count and counting rules, then record citations, brand mentions, competitors and prominence in a spreadsheet. Automation can make AI visibility tracking more efficient at scale, but the measurement protocol should still remain clear and consistent.
If your website has not yet established an AI visibility baseline, our SEO and AI Search Audit can be a starting point. It includes recommendation-rank checks across ChatGPT, Perplexity, Gemini and Google AI Overviews alongside technical and content checks.